Graphing IRC server logs
I wanted to graph my IRC server logs to see the number of connects and disconnects. The raw logs look something like this:
[Tue Apr 15 01:12:17 2014] - Disconnect - (2:42:4) Wibben!Wibben@b.clients.kiwiirc.com [VHOST ht-A107D790.clients.kiwiirc.com]
[Tue Apr 15 02:05:43 2014] - Connect - tlotr!tlotr@b.clients.kiwiirc.com [VHOST ht-A107D790.clients.kiwiirc.com]
[Tue Apr 15 07:10:48 2014] - Disconnect - (5:5:9) tlotr!tlotr@b.clients.kiwiirc.com [VHOST ht-A107D790.clients.kiwiirc.com]
[Tue Apr 15 18:45:05 2014] - Connect - Hackay!Hackay@a.clients.kiwiirc.com [VHOST ht-61603BBC.clients.kiwiirc.com]
[Tue Apr 15 20:26:51 2014] - Disconnect - (1:41:50) Hackay!Hackay@a.clients.kiwiirc.com [VHOST ht-61603BBC.clients.kiwiirc.com]
[Tue Apr 15 21:20:49 2014] - Connect - GitBot!GitBot@192.30.252.32 [VHOST E6E15C00.66544FCE.B7AE2E1.IP]
[Tue Apr 15 21:20:50 2014] - Disconnect - (0:0:5) GitBot!GitBot@192.30.252.32 [VHOST E6E15C00.66544FCE.B7AE2E1.IP]
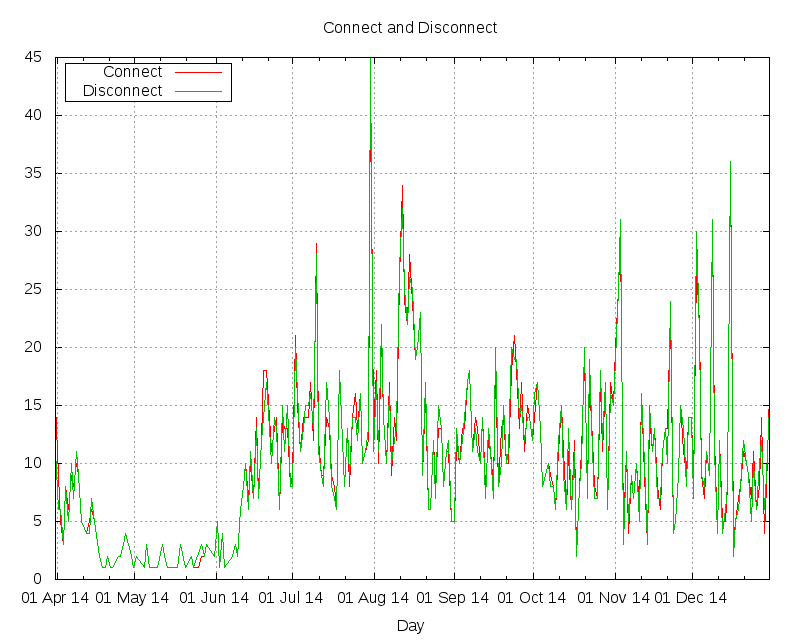
What I want it to look like is this:
I used the cut command to strip out just the bits I want, tr makes sure that there is only one space.
cat ircd.log | tr -s ' ' ' ' | cut -d ' ' -f1,2,3,5,7
So it looks like this:
[Wed Oct 28 2015] Connect
[Wed Oct 28 2015] Connect
[Wed Oct 28 2015] Disconnect
[Wed Oct 28 2015] Connect
Then I used sublime to remove the brackets and the days, then replaced the spaces between the date with a hyphen and placed a comma to separate the values. Yeah, I’m lazy and could not be bothered to workout some regular expression.
date,s
Oct-28-2015,Connect
Oct-28-2015,Connect
Oct-28-2015,Disconnect
Oct-28-2015,Connect
Now to help me graph the data I needed to group it into days, and count the number of instances. I used a cool python script called q which allows me to apply SQL like statements to a CSV file. The command will count all disconnects and groups them on the date.
./q -H -d , "select date, count(*) from data.csv where s = 'Disconnect' group by date"
Now I’m left with a list of dates, yay, but wait they are in alphabetical order, when it is graphed it looks crazy:
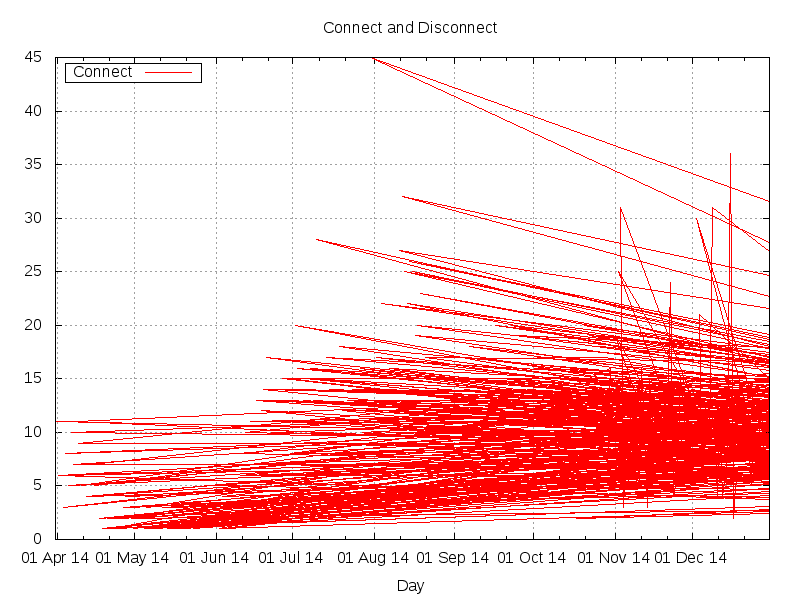
So now I had to sort it into date order.
grep -v 2015 data.connect | sort -k1M -k1.5n -R
This says to pipe all lines which does not have 2015 (I couldn’t work out how to sort including the year) into the sort command. -k1M, Means column one order by Months, -k1.5n, means to take column 1 char 5 and sort it as a number. and the -R means to reverse it. See all in the right order.
Nov-29-2014 9
Nov-30-2014 14
Dec-1-2014 14
Dec-2-2014 8
Dec-3-2014 27
Now the data is ready to be graphed, I like gnuplot. This is the script used to generate the graph. Note the time format which has to match the data, and the xrange, which is the first and last instance of the data.
set terminal png size 1200,800
set xdata time
set timefmt "%b-%d-%Y"
set format x "%d %b %y"
set output "irc.png"
# time range must be in same format as data file
set xrange ["Apr-1-2014":"Dec-31-2014"]
set yrange [0:45]
set grid
set xlabel "Day"
set title "Connect and Disconnect"
set key left box
plot "data.connect" using 1:2 index 0 title "Connect" with lines, \
"data.disconnect" using 1:2 index 0 title "Disconnect" with lines
Then generating the image is as easy as:
cat plot.conf | gnuplot
Thank to Ron Peterson for, well doing it before me :D http://linuxgazette.net/126/peterson.html